The Fed as global repo dealer
Overnight rates during the pandemic
Updated to fix link to new working paper.
In a new working paper, my former professor and sometime co-author Perry Mehrling sketches an outline of the international monetary system. The paper's key contribution, in my view, is to conceive of the Federal Reserve as supporting a tiered, dollar-based global system through the lens of last-resort liquidity provision.
The system is hierarchical along two main axes. One axis has to do with global political economy: the US domestic system is at the core, rich countries with access to central bank FX swap lines a bit farther out, other countries who can only borrow against collateral even farther. A second axis has to do with the term structure: overnight markets first, short-term money markets farther out, and capital markets even farther.
Perry thinks of the Fed as a market-maker for the global dollar. The central bank's ability and willingness to influence this system is greater close to the core, and at the short end of the term structure. I accept, perhaps unsurprisingly, this vision of the global monetary system and the incremental changes that have given rise to it.
The centerpiece of the paper is Figure 2, where the logic of market-making is extended over both the political-economic (vertical) and the term-structure horizontal axis. In what follows I want to build out the upper-left corner of the diagram.
Overnight rates during the pandemic
This figure shows overnight money-market interest rates from April 2020 to the present. Note that the tri-party general collateral rate, an inclusive measure of repo funding costs, has set consistently set a floor under these rates. The interest rate on reserve balances, paid by the Fed to commercial banks on their reserve deposits, has likewise defined a ceiling. The exceptions to these patterns are associated with significant stresses in these markets.
The picture shows, to my eye, three main phases in the working of money markets since the onset of the pandemic. The first, from March until about July 2020, encompassed the onset of and initial interventions associated with the pandemic. The second phase, from July 2020 until March 2021, is marked by upward pressure on short-term rates, visible in the graph as a high clustering of the lines, capped from above by the IORB rate ceiling at 10 basis points. The third phase, from March 2021 to the present, is marked by downward pressure on short-term rates, visible in the graph as a low clustering of rates, bounded below by the tri-party general collateral rate at 1 basis point until June 2021, and 5 basis points since then.
Note that interest on reserves sets an upper bound for these rates, because as long as banks can add reserves, they can pay interest to depositors up to that level. Likewise, ON RRP sets a lower bound for overnight rates, because even if no one else will accept deposits, the Fed will still pay that much in interest. The upper-left Treynor diagram in Perry's new paper, which describes this part of the system, thinks of interest on reserves as the floor, and the discount rate as the ceiling. But this, I think, is not a correct description for the current pattern of overnight rates.
I have written about the first phase previously. Here I want to focus on the second and third phases.
Adding and draining reserves during the pandemic
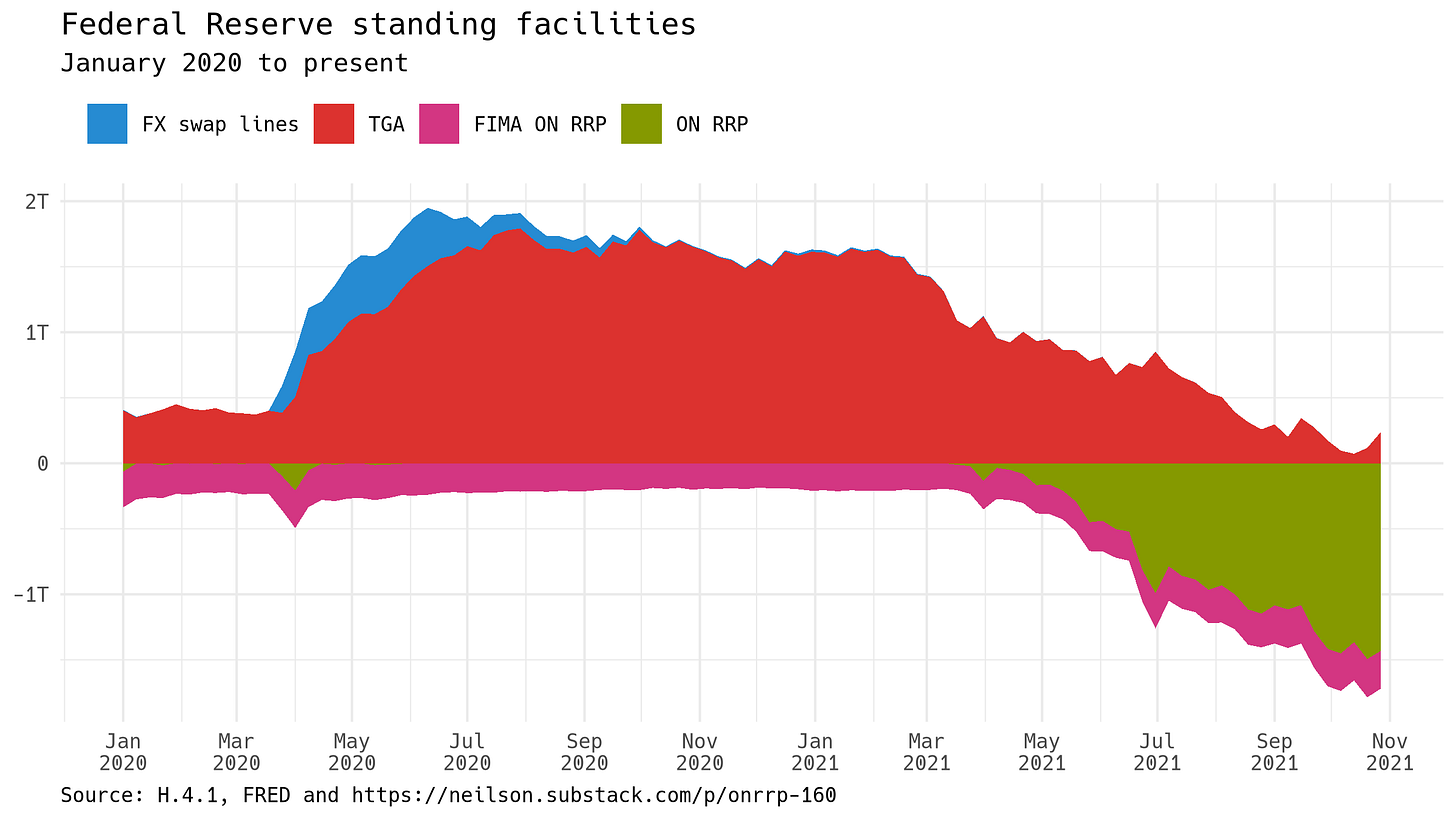
This graph shows usage of the Fed's standing facilities. The Treasury General Account and the FX swap lines with other central banks are ways of adding reserves. The two overnight reverse repo deposit facilities, for domestic depositors (in green) and foreign central banks (magenta) are ways of draining reserves.
Comparing with the graph of money-market interest rates above, usage of the standing facilities falls into the same periodization: an early phase, until July 2020, with fast expansion of reserves; a second phase, from July 2020 until March 2021, with the reserve-adding facilities heavily drawn; and a third phase, from March 2021 to the present, with the reserve-absorbing facilities seeing increasing usage.
The Fed as money-market dealer
These two phenomena—the pattern of money-market rates and the usage of the standing facilities, can be understood together by thinking of the Fed as making an overnight market for reserves. When the central bank's counterparties want more reserves, then it's a lender's market, so rates rise, bounded from above by the Fed's interest rate on reserve balances, and the lending standing facilities see usage. When the central bank's counterparties want fewer reserves, then it's a borrower's market: rates fall, bounded from below by the rate at which the Fed will accept unlimited repo deposits.
As Perry's paper notes, the international monetary system is always changing, driven by circumstances and in general by pragmatism. With central banks, and the Fed in particular, beginning to move away from asset purchases, these patterns may well change again.


《The Treasury General Account and the FX swap lines with other central banks are ways of adding reserves.》
Why doesn't the TGA drain reserves, because they leave private banks?