Taper plans
The Fed in the capital markets and money markets
After last week's meeting of the Federal Open Market Committee, it seems that the monetary policy-making body of the US central bank has moved from "thinking about thinking about" tapering to actually thinking about tapering. For now, asset purchases continue at $120 billion per month. It may still be some months before that number starts to fall, but the Fed is already making actual changes in preparation. In particular the standing repo facility, which I wrote about after the June meeting, is now official.
It seems likely that initial uptake of the SRF will be low, though Zoltán Pozsár points out that it could lead banks to hold Treasuries instead of reserves, even without being used. One way to make some sense out of the multiple moving parts is to draw out an explicit connection between the Fed's interventions in capital markets, at the longer end of the yield curve, and its interventions in money markets, at the short end. In this post I try to put together a simple framework for thinking about that, which could come in useful as the taper begins.
Capital markets
The Fed's asset purchases have come in the form of $80 billion per month in Treasuries and $40 billion per month in mortgage-backed securities. Why so many mortgages? The central bank first purchased MBS in the final phase of the 2008 crisis. At that time, it made sense as a way of responding directly to the financial crisis: no one wanted to hold all the mortgages, so the Fed bought them. This set a floor under the price, and restarted the frozen market, for the highest-quality mortgage securities, and therefore for the entire US mortgage market.
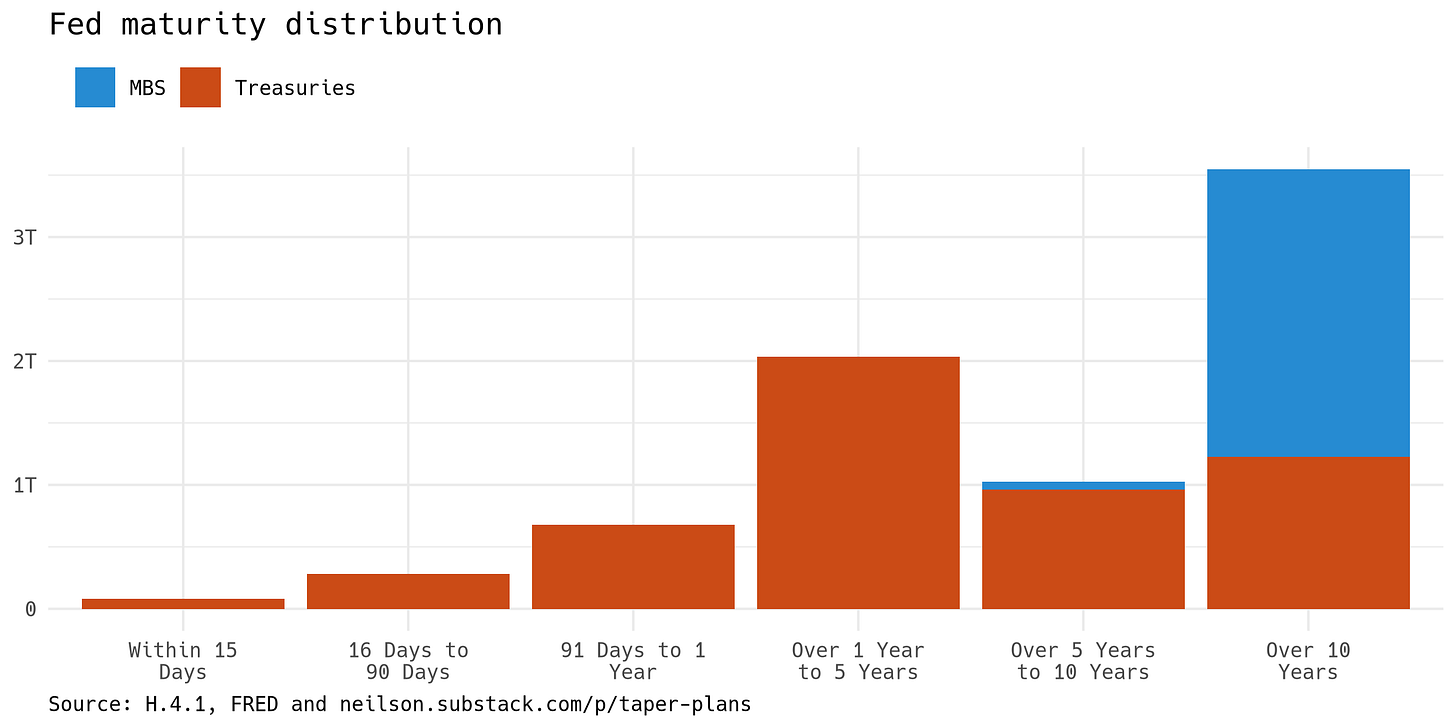
Mortgage securities had a direct connection to the financial problems of 2008, whereas their connection to today's situation seems less clear. The graph below offers a suggestion. The data, from Table 2 of the Fed's H.4.1 release, shows the maturity profile of the central bank's asset holdings: for Treasuries, about $2 trillion in the one-to-five-year range, about $1 trillion in the five-to-ten-year and more-than-ten-year ranges, and smaller amounts in the other ranges. Its $2.4 trillion in mortgage securities, by contrast, are almost all in the more-than-ten-year range.
This makes sense if we think of the Fed as using asset purchases to push down on interest rates at the long end of the yield curve, while trying not to bend the curve out of shape. To do this, it needs a market where it can buy lots of securities with greater than ten years' maturity. The mortgage-backed securities market provides sufficient liquidity and credit quality to serve that purpose. In effect, the Fed has two ways of lending to the US public: through the state, by buying Treasury securities, and through the housing market, by buying MBS.
Money markets and the standing repo facility
While the Fed uses these purchases in capital markets to try to pull down long rates, the money created by these purchases also has to go somewhere. The overnight reverse repo facility has been the marginal channel for these funds since March 2021. This graph of money market rates shows that ON RRP, in the tri-party repo market, the green line, has put a floor under overnight rates.
What will happen when asset purchases slow and stop? The FOMC indicated some of what it is thinking about this question when it established a standing repo facility last week. The SRF will lend reserves into the money markets on the initiative of primary dealers, and starting Oct. 1 banks can also apply to become counterparties. The SLR rate is currently set at 25 basis points, so higher than any of the rates on the graph.
Until now, the Fed has been adding reserves quickly enough that only the lower limit to overnight rates has had any effect—the ON RRP facility has kept rates from going below zero. But as asset purchases start to fall, reserves will be added more slowly. Overnight rates may then swing around. If money market funds still want to place funds with the Fed, the ON RRP facility could continue to see use. If there is demand for borrowed overnight funds at 25 bp, the SRF facility would come into use. In between, there should be a range of interest rates between 5 and 25 bp, at which neither of the Fed's facilities would be used.
This, then, is the challenge for the Fed: to bring asset purchases down in such a way that demand for overnight funds leaves the price between those two levels.


Hi Daniel, I have taken Mehrling's online course back in 2013 and it impression is lasting. In the H 4.1 release, table 1 "repurchase agreements" shows "0" zero, but in table 2 Maturity, it shows 1,267,998. That would bring the balance sheet tp over 9 Trillion. Do you know why it is not mentioned in the 1st table ". Factors Affecting Reserve Balances of Depository Institutions"? Thanks