T accounts
How I make wysiwyg balance sheet images quickly

Tl;dr: box-drawing characters and ImageMagick.
One feature of Soon Parted is the use of T accounts to show balance-sheet relationships. I am sometimes asked how I make them. T accounts are a helpful way to talk about money and finance, and if more people could make good ones more quickly and easily, we would collectively know more about how the financial system works. So I am happy to share my technique, which is fast and flexible, although it does require some technical chops.
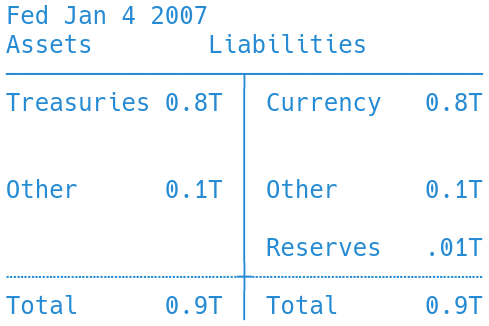
For each T account image, I make a text file using box-drawing characters for the lines. Here’s a notable example (it shows the balance sheet of the US Federal Reserve as it was before the 2008 financial crisis):
Fed Jan 4 2007
Assets            Liabilities
────────────────┬────────────────
Treasuries 0.8T │ Currency   0.8T
                │
                │
Other      0.1T │ Other      0.1T
                │
                │ Reserves   .01T
┈┈┈┈┈┈┈┈┈┈┈┈┈┈┈┈┼┈┈┈┈┈┈┈┈┈┈┈┈┈┈┈┈
Total      0.9T │ Total      0.9T
What’s nice about this is that it is both a) what-you-see-is-what-you-get and b) plain text. If you are handy with a text editor, such things can be made very quickly, fast enough even to make T accounts for Twitter debates.
To make the text files into PNG images, I use the convert tool from the ImageMagick suite (which I use on Arch Linux). convert has an -annotate function which does what we need:
convert -size 2000x1000 xc:#ffffff -family Hack \
    -pointsize 24 -interline-spacing -5 -fill #8959a8 \
    -annotate +15+30 u/infile -trim -border 2 \
    png:outfile
It matters what font you use, because not all fonts have all of the box-drawing characters. Also one has to fiddle with the -interline-spacing argument in order to get the vertical lines to close up. I use the Hack font at 24 points, with interline spacing of -5, which gives output like this:
One alternative approach, which avoids ImageMagick, would be to make the T accounts in plain text files as above, but then use a screen capture tool to make the image file. That would still be quite fast, though harder to automate.
Two requests
I like my way of doing this, but it might not work for others. If you have your own fast way of making T accounts that you think could be helpful to readers, kindly share in the comments.
Also, if anyone can figure out how to adapt this system to make Treynor diagrams, please share! At the moment I use tikz, which is not wysiwyg:

\definecolor{soonparted}{HTML}{268bd2}
\begin{tikzpicture}[soonparted, scale=2]
    \coordinate (x) at (-1, 1);
    \coordinate (y) at (1, -1);
    \coordinate (z) at (1, 1.7);
    \draw (-1.1, 0) node[left] {\shortstack{Repo \\ rate}};
    \draw (0, -1) -- (0, -1.04) node[below] {0};
    \draw (0, -1.3) node[below] {\shortstack{Dealers net repo}};
    \draw (x) -- (-1, -1) node[below] {\shortstack{Dealers \\ max short}} -- (y)
    node[below] {\shortstack{Dealers \\ max long}} -- (z);
    \coordinate (vbtax) at (-1, -0.7);
    \coordinate (vbtbx) at (-1, -0.3);
    \coordinate (vbtan) at (1,   0.3);
    \coordinate (vbtbn) at (1,   0.7);
    \draw (1,  1.65) -- (1.04,  1.65) node[right] {\shortstack{FX swap lines \\ rate \\ (CIP+50bp) }} ;
    \draw (1,  0.7) -- (1.04,  0.7) node[right] {\shortstack{SRF/FIMA \\ repo \\ rate \\ (25bp)}} ;
    \draw (1, -0.7) -- (1.04, -0.7) node[right] {\shortstack{ON RRP \\ rate \\ (5bp)}};
    \draw[densely dotted] (1.7, 0.7) -- (1.74, 0.7) -- (1.74, -0.7) -- (1.7, -0.7);
    \draw (1.74, 0) node[right] {\shortstack{Outside \\ spread}};
    \draw[dashed] (vbtax) -- (vbtan);
    \draw[dashed] (vbtbx) -- (vbtbn);
    \draw (0.06, -.35) node[right] {\shortstack{Inside \\ spread}} ;
\end{tikzpicture}
I like the "fast enough for Twitter arguments" ideal. I don't think I've used balance sheets in any Twitter arguments yet.
I use Google Sheets for my balance sheets because it allows me to easily color code based on Borja Clavero's payment type classification.
This is what I did for the 2021 run-through of Money and Banking on Reddit.
https://www.reddit.com/r/moneyview/comments/m0zzr1/money_and_banking_summer_2021/