Off the floor
A rather technical note for Fed-watchers
Monetary policy is typically discussed in terms of one instrument and one effect: the level of the federal funds rate as a way to affect the pace of changes in consumer prices. The success of tightening monetary policy, according to this view, is measured by falling inflation rates, and so the top of the tightening cycle is reached when inflation is seen to be decisively under control.
There is another way to measure monetary conditions, however, much closer to the markets where these conditions are determined. In today’s post, an argument that normal market-making has begun to return to the money markets.
The overnight rate complex
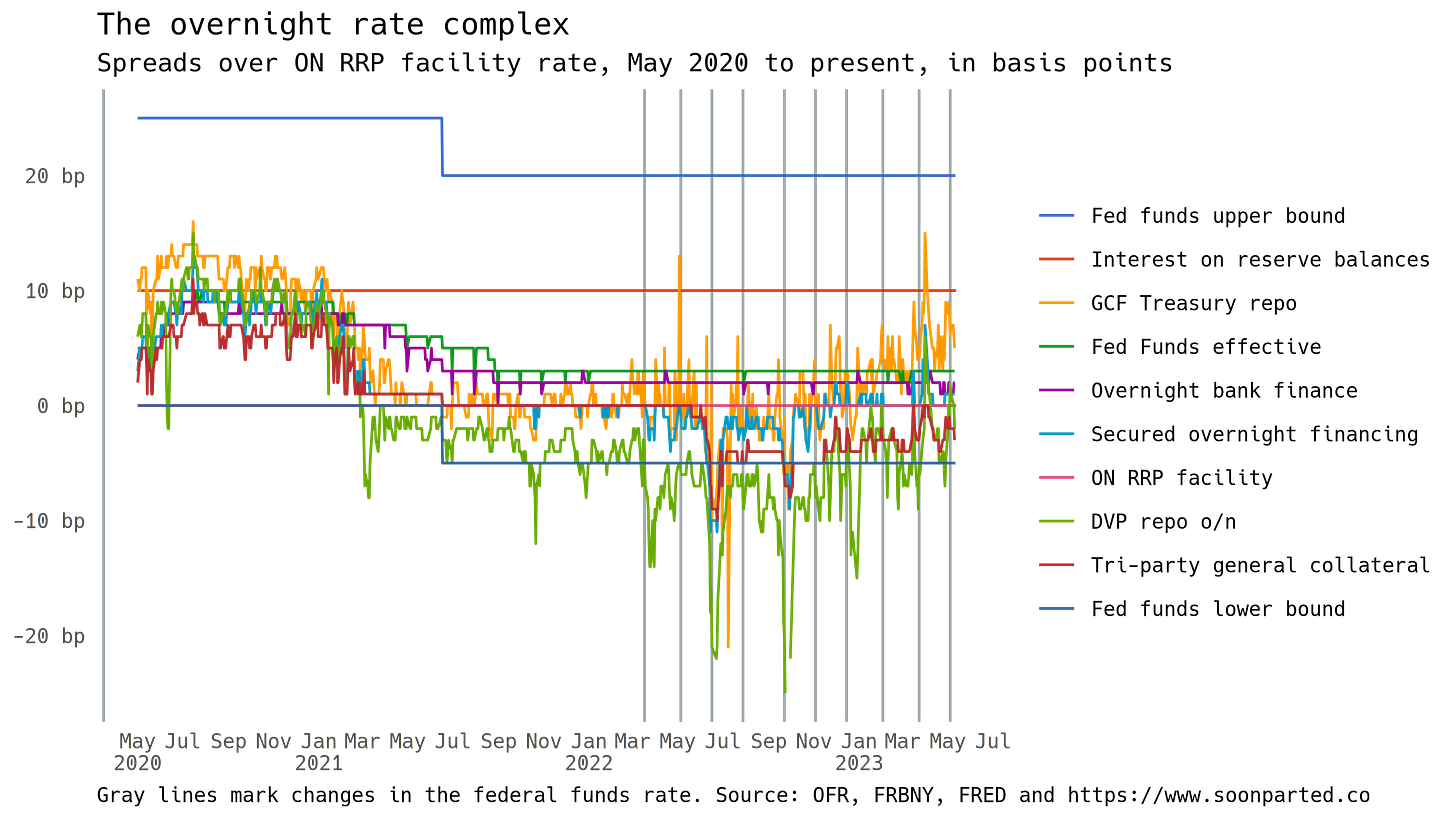
This graph shows the most important overnight dollar interest rates. Four of them—the federal funds upper and lower bounds, interest on (banks’) reserve balances, and the overnight repo deposit (ON RRP)—are administered rates (flat lines); the others are market rates. Each rate is expressed as a spread above the ON RRP rate (explained below). The rates move together, so the last year’s rate increases are mostly factored out. The message is in the overall shape, not in the details:
During the first year of the pandemic, the Fed’s quantitative easing asset purchases flooded through the financial system. Even after the lowest rates were brought to zero, the central bank’s balance-sheet expansion continued to push down on the other rates, from a normal-ish spread of 10bp above the ON RRP rate in mid-2020 to zero and negative spreads by late 2021 and into 2022.
The purpose of the ON RRP facility is to provide a destination for the funds created by quantitative easing: money market funds, swollen with deposits, are entitled to place funds at the Fed and receive overnight interest payments at the ON RRP rate. The amount of these deposits has had no effective limit.
The ON RRP rate should therefore serve as a floor to overnight rates, because no one should need to accept a lower rate than what the Fed offers. That floor, at the zero line in the graph, began to shape the pattern of overnight rates in early 2021. As usage of the ON RRP facility grew over the next year, this lower bound was repeatedly tested, especially in the DVP segment of the repo market, which stayed more than 5bp below ON RRP for most of 2022. This indicates very strained market conditions.
Tighter money
Market rates at or below the ON RRP rate mean that the Fed itself is the destination for marginal funds in the money market. It sets that rate, and if depositors accept it, then that means there are not better rates available. In other words, it means that money-market rates are being directly set by the Fed’s transactions at those rates.
To my eye, the pattern in overnight rates looks very different starting around the turn of 2023:
The GCF, tri-party and DVP segments of the repo market have all stepped upward in recent weeks. The more that repo rates print at a positive spread above ON RRP, the less direct is the Fed’s management of the day-to-day price of money. That price is increasingly set through private market-making, which is an indication of non-crisis monetary policy.
So, prediction for Fed-watchers: a very strong sign that rates have peaked will be daylight between the repo rates complex and the ON RRP rate.

