Forward markets in dollar-renminbi foreign exchange
Expectations and liquidity
In a series of recent posts, I have been investigating some of the intricacies of China’s dollar banking system. The country’s financial institutions report a foreign-currency-denominated balanace sheet of about a trillion dollars.
The People’s Bank of China’s main day-to-day instrument of monetary policymaking is the exchange rate between the dollar and the renminbi. It seems likely that the proximate dollar instrument for this market is offshore (i.e., Eurodollar) deposits at Chinese banks. Today, some notes on China’s domestic foreign exchange market.
The PBC’s main policy variable is the exchange rate fixing, the so-called parity rate, which is published daily and which serves as a key reference for foreign-exchange trading. The parity rate is an administered rate, integrated with market mechanisms: it is not solely determined by market forces, but neither are policymakers free to set it arbitrarily. This graph shows the central parity rate for 2006 forward. The daily time series is a quantity of onshore renminbi (i.e., CNY) per US dollar, and is plotted on an inverted scale, so that upward movement on the graph intuitively indicates renminbi appreciation.
Management of the CNY/USD exchange rate has gone through several phases over the years: until mid-2008, the renminbi appreciated steadily. This halted in the wake of the 2008 crisis, and resumed two years later. Since then, the parity rate has been managed up and down between about 7.25 and 6.25. This periodization of the exchange rate can also be understood in relation to the PBC’s balance sheet. Spelling out this relationship would certainly be part of a complete story of China’s exchange-rate policy, but I will leave the balance sheet quantities for another day.
For now, I will stick with prices. China’s domestic spot foreign exchange markets are supported by a system of forward markets. In a forward exchange transaction, the terms of the trade are set today, with settlement to occur on a specific date in the future.
The possibility of entering into forward transactions, in any market, gives the counterparties flexibility as to the time of settlement—from overnight out to one year, in the case of CNY/USD forwards. A borrower with a dollar payment due in six months, for example, can use forward transactions to plan their CNY and USD cash flow quite flexibly. Without forward markets, all buying and selling of foreign exchange would have to be in the spot market. We can reasonably say that China’s forward FX market serves to absorb what would otherwise be pressure on the spot exchange rate. (This argument parallels a key point we make in the stablecoins paper, talking there about different markets.)
This graph shows CFETS’s series of market prices for foreign exchange forwards, for a range of maturities, from mid-August forward. Over this time period, the different forward rates are well organized, with a more valuable renminbi the farther into the future one looks:
Why are forward rates arranged in this way? Two explanations suggest themselves. The first is that market participants expect RMB appreciation over the next year, and that appreciation is priced into forward rates. Noting that that renminbi is at its cheapest level since 2008, it is easy to make a case for appreciation. Indeed, the RMB got a big bump in mid-November, and perhaps there is more to come. But as the graph shows, the entire set of forward rates shift upward at the same time—the one-year forward rate continues to price in as much appreciation as it did before.
The second explanation is that forward rates reflect a liquidity premium. After all, entering into a forward contract commits both parties to a future cash flow. The forward rate should reflect not only the cost of exchanging one currency for another, but also the cost of generating positive cash flow at maturity.
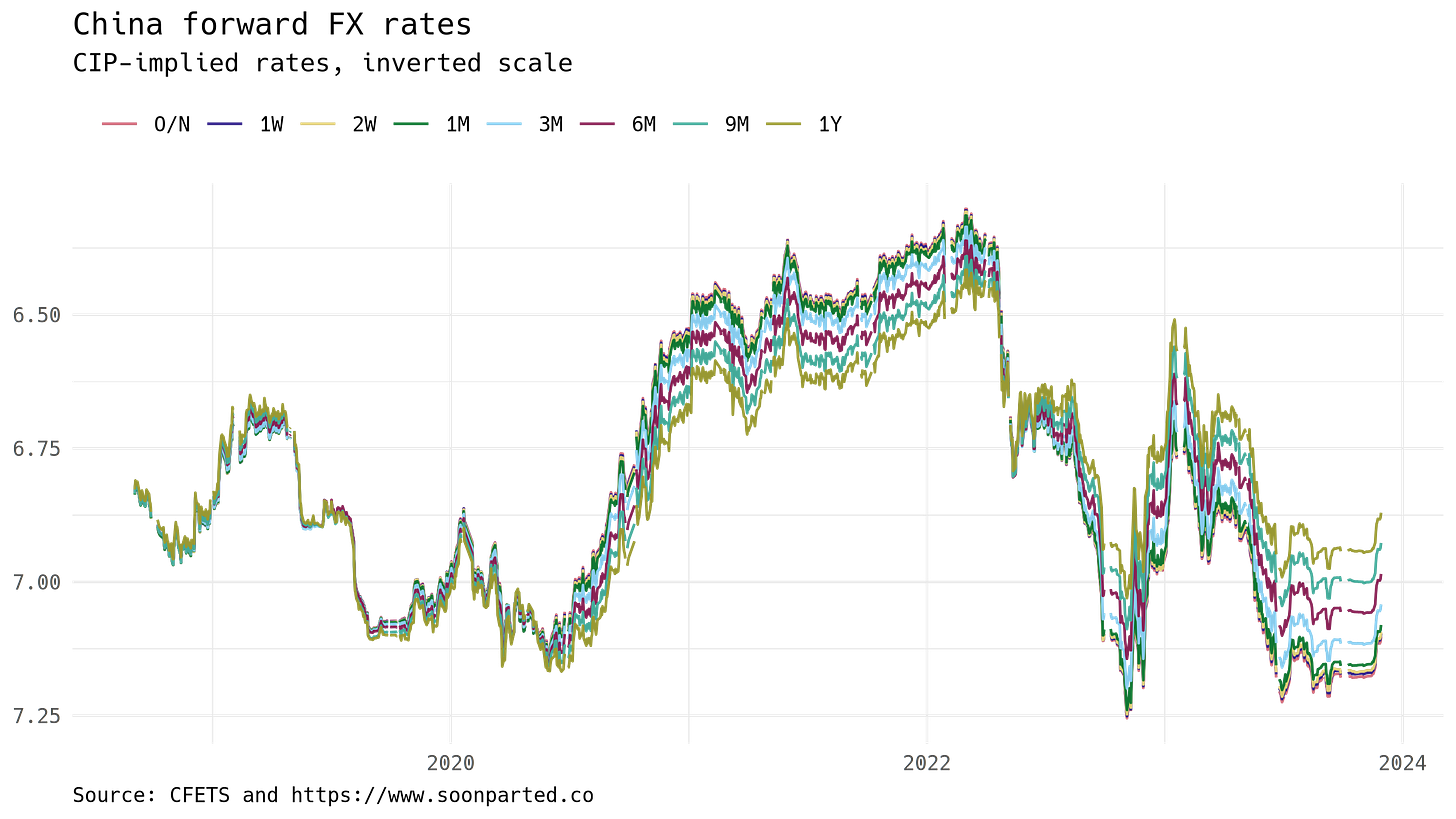
CFETS reports market FX quotes only for the most recent three months. However the agency posts longer series of both renminbi and dollar interbank interest rates (Shibor and Ciror, respectively). Using covered interest parity, it is possible to construct a longer series of forward exchange rates:
Over the last few weeks, these CIP-implied rates track the market rates in the graph above. The rates have been arranged top-to-bottom since a big devaluation in mid-2022. Before that, forward rates were arranged in the opposite direction, with nearer maturities priced above farther maturities. One might say that markets correctly anticipated the coming devaluation, but it seems equally possible that fluctuations in available liquidity are part of the explanation.
Any readers who have spent a lot of time with this data, please get in touch.


