QT flows
Money funds have moved from repo deposits to T-bills
The biggest monetary innovation of the COVID-19 pandemic was the expansion of overnight repo (ON RRP) deposit facility. By 2020, the ON RRP facility had already existed for some years, but it had never seen extended use at scale. But ON RRP proved to be a suitable channel to absorb the massive financial flows generated by the Fed’s asset purchases, especially starting in 2021. The balance at the deposit facility was over $2 trillion for months.
These repo deposits have been expected to fall as part of so-called normalization, but only in recent weeks has that expectation become a reality. With June data now available both from the US Treasury, on outstanding securities, and from the OFR, on money market fund holdings, a clearer picture emerges of the financial flows between the US Treasury, money market funds, and the Federal Reserve.
Treasury
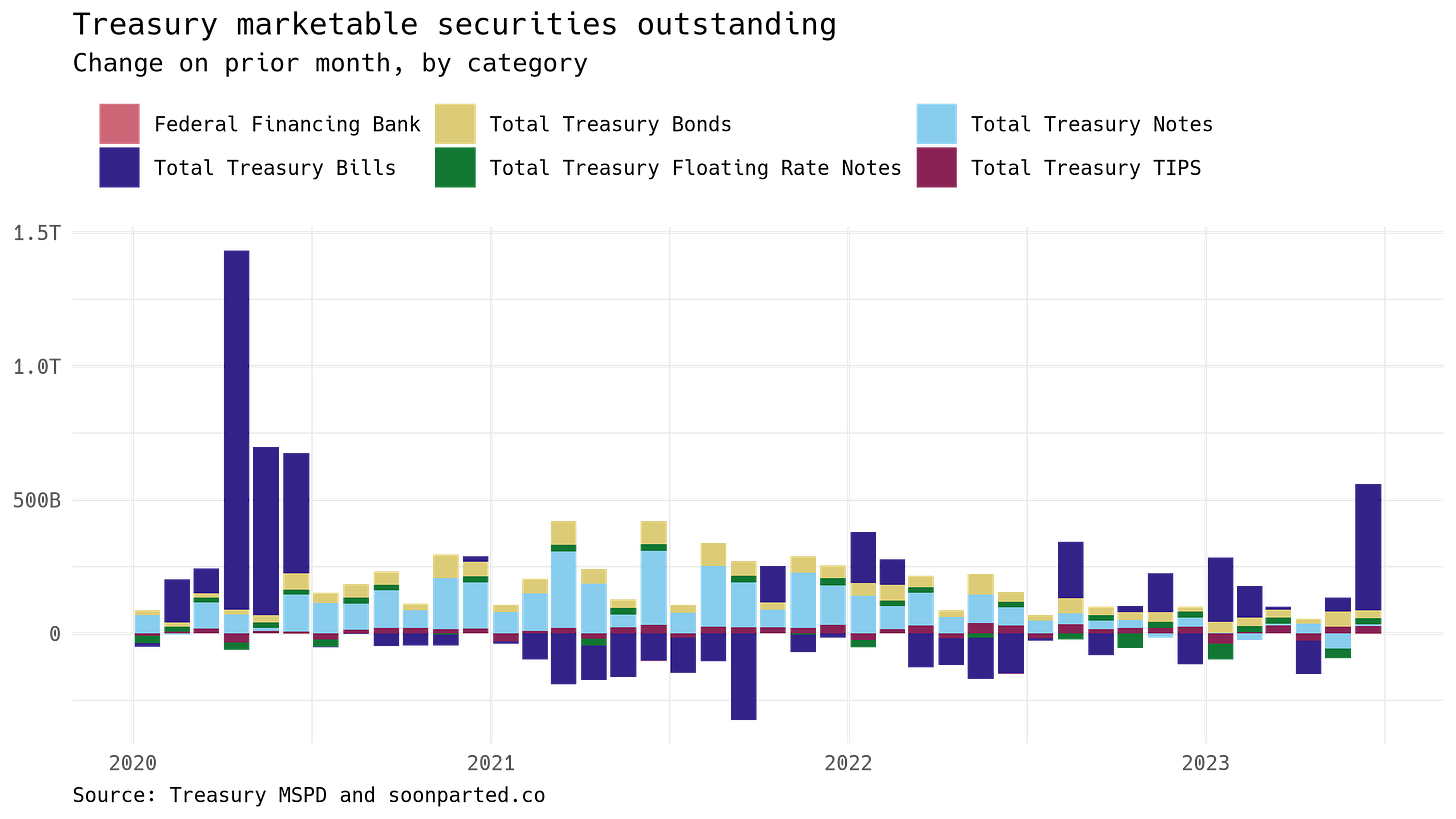
The US Treasury reached the debt ceiling early in 2023, so that it could only borrow to replace maturing debt. In June, Congress suspended the debt ceiling, and the Treasury promptly issued about $500 billion in short-term debt securities. This graph shows the month-on-month change in the amount of marketable Treasury securities outstanding, broken down by category:
When the Treasury borrows, the money raised shows up first in the Treasury General Account, the US government’s deposit account at the US Fed. The TGA balance is now close to its normal level of around half a trillion, so June’s big bill issuance is not likely to be repeated.
Money funds
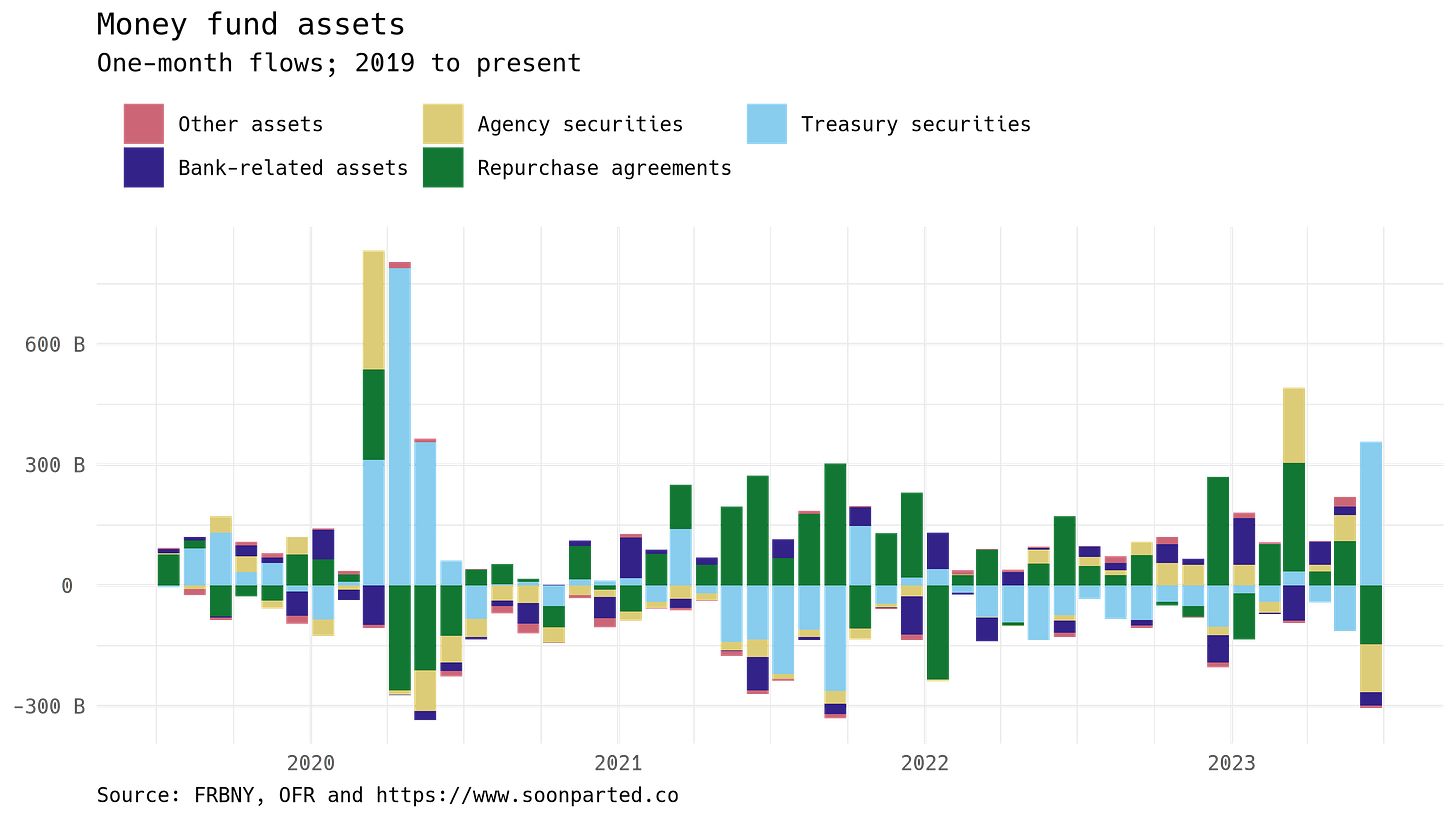
Who bought the Treasury bills? The Office of Financial Research tracks the securities holdings of US money market funds, at a high level and at a monthly frequency. This graph shows the month-on-month change in asset holdings by US money market funds:
The graph shows that money funds bought some $300 billion in Treasury securities in June, probably mostly T-bills. But total money fund assets expanded only by a small amount, so these purchases were paid for mostly with decreases in the holdings of other assets, specifically agency securities and repo.
Fed
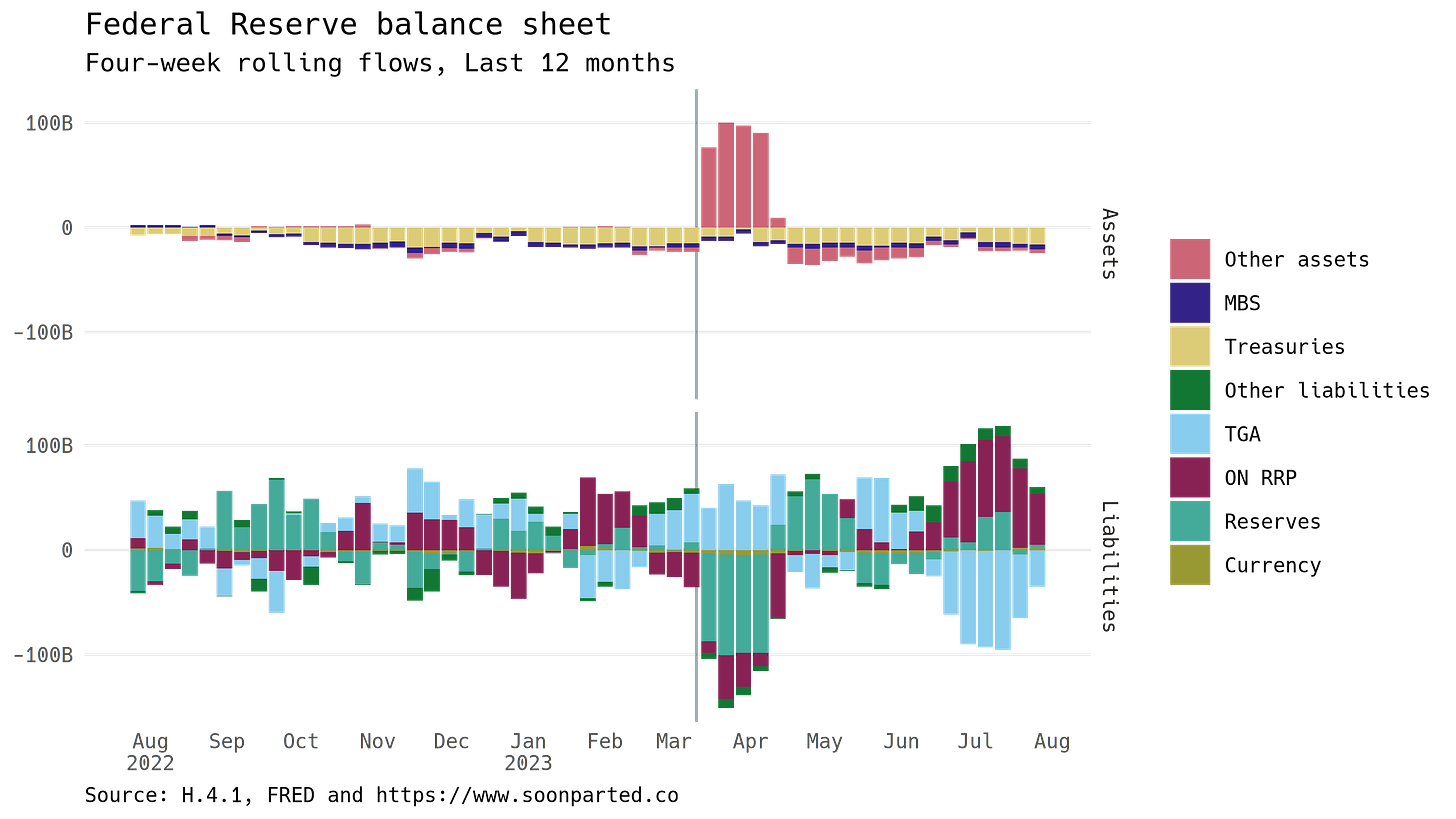
Much of money funds’ repo assets has taken the form of overnight repo deposits at the Fed’s ON RRP facility. This graph shows four-week rolling flows on the Fed’s balance sheet. Asset flows are above: other than the SVB episode, quantitative tightening has been proceeding apace. Liabilities are below, and here we see the other side of money funds’ movement into T-bills. The ON RRP facility has contracted by several hundred billion dollars since the beginning of June. At the same time, the TGA has been expanding:
The expansion of the TGA is a bit less than the contraction of the ON RRP facility, so that the liability side ends up contracting on net, exactly in line with the asset side.
Closed circuit
Finally, all of this can be put fairly neatly into T accounts. The accounting is not perfectly watertight: the Treasury has issued more T-bills than money funds have bought; they must be sitting somewhere else at the moment. Maybe they are in dealer inventories and they will show up with money funds eventually. I also don’t know yet who is buying mortgage-backed securities and agency debt.
Treasury issuance should slow, now that the TGA balance is close to its normal level. But the Fed continues to reduce the size of its balance sheet. Its total liabilities will necessarily continue to contract. Which liability lines contract, whether ON RRP or bank reserves, remains to be seen.


