Unwinding
Usage of the Fed’s ON RRP deposit facility has begun to contract

Most discussion of monetary policy is based on an underlying Keynesian logic: central banks raise interest rates, and some time later, inflation falls. Central banks use this frame themselves. From such a perspective, the current policy challenge for the Fed is this: rates have been raised, quite sharply in fact, but inflation remains high. One begins to wonder whether short-term rates have much purchase on the price level after all.
Lest we be distracted by the dance of short-term rates, however, we should bear in mind that the Fed is simultaneously conducting another kind of monetary policy: the US central bank is contracting its balance sheet, and rather rapidly. In an important shift, this so-called quantitative tightening has now reached one of the Fed’s major crisis interventions: usage of the overnight reverse repo (ON RRP) facility, a standing repo deposit mechanism for money market funds and banks that had expanded to $2 trillion at the height of the COVID-19 pandemic, has finally started to show clear signs of contraction.
Contraction was absorbed by falling government deposits
After $4 trillion of asset purchases between 2020 and 2022, the US central bank began to contract its balance sheet a bit more than a year ago. This graph shows the main components of the Fed’s balance sheet. Assets are in the upper panel, where the recent runoff of the central bank’s holdings of Treasuries and mortgage-backed securities is apparent. Vertical lines indicate various turning points in the path of financial relationships described by the balance sheet, most recently around the SVB panic in March 2023, where emergency lending shows up as “Other assets”:
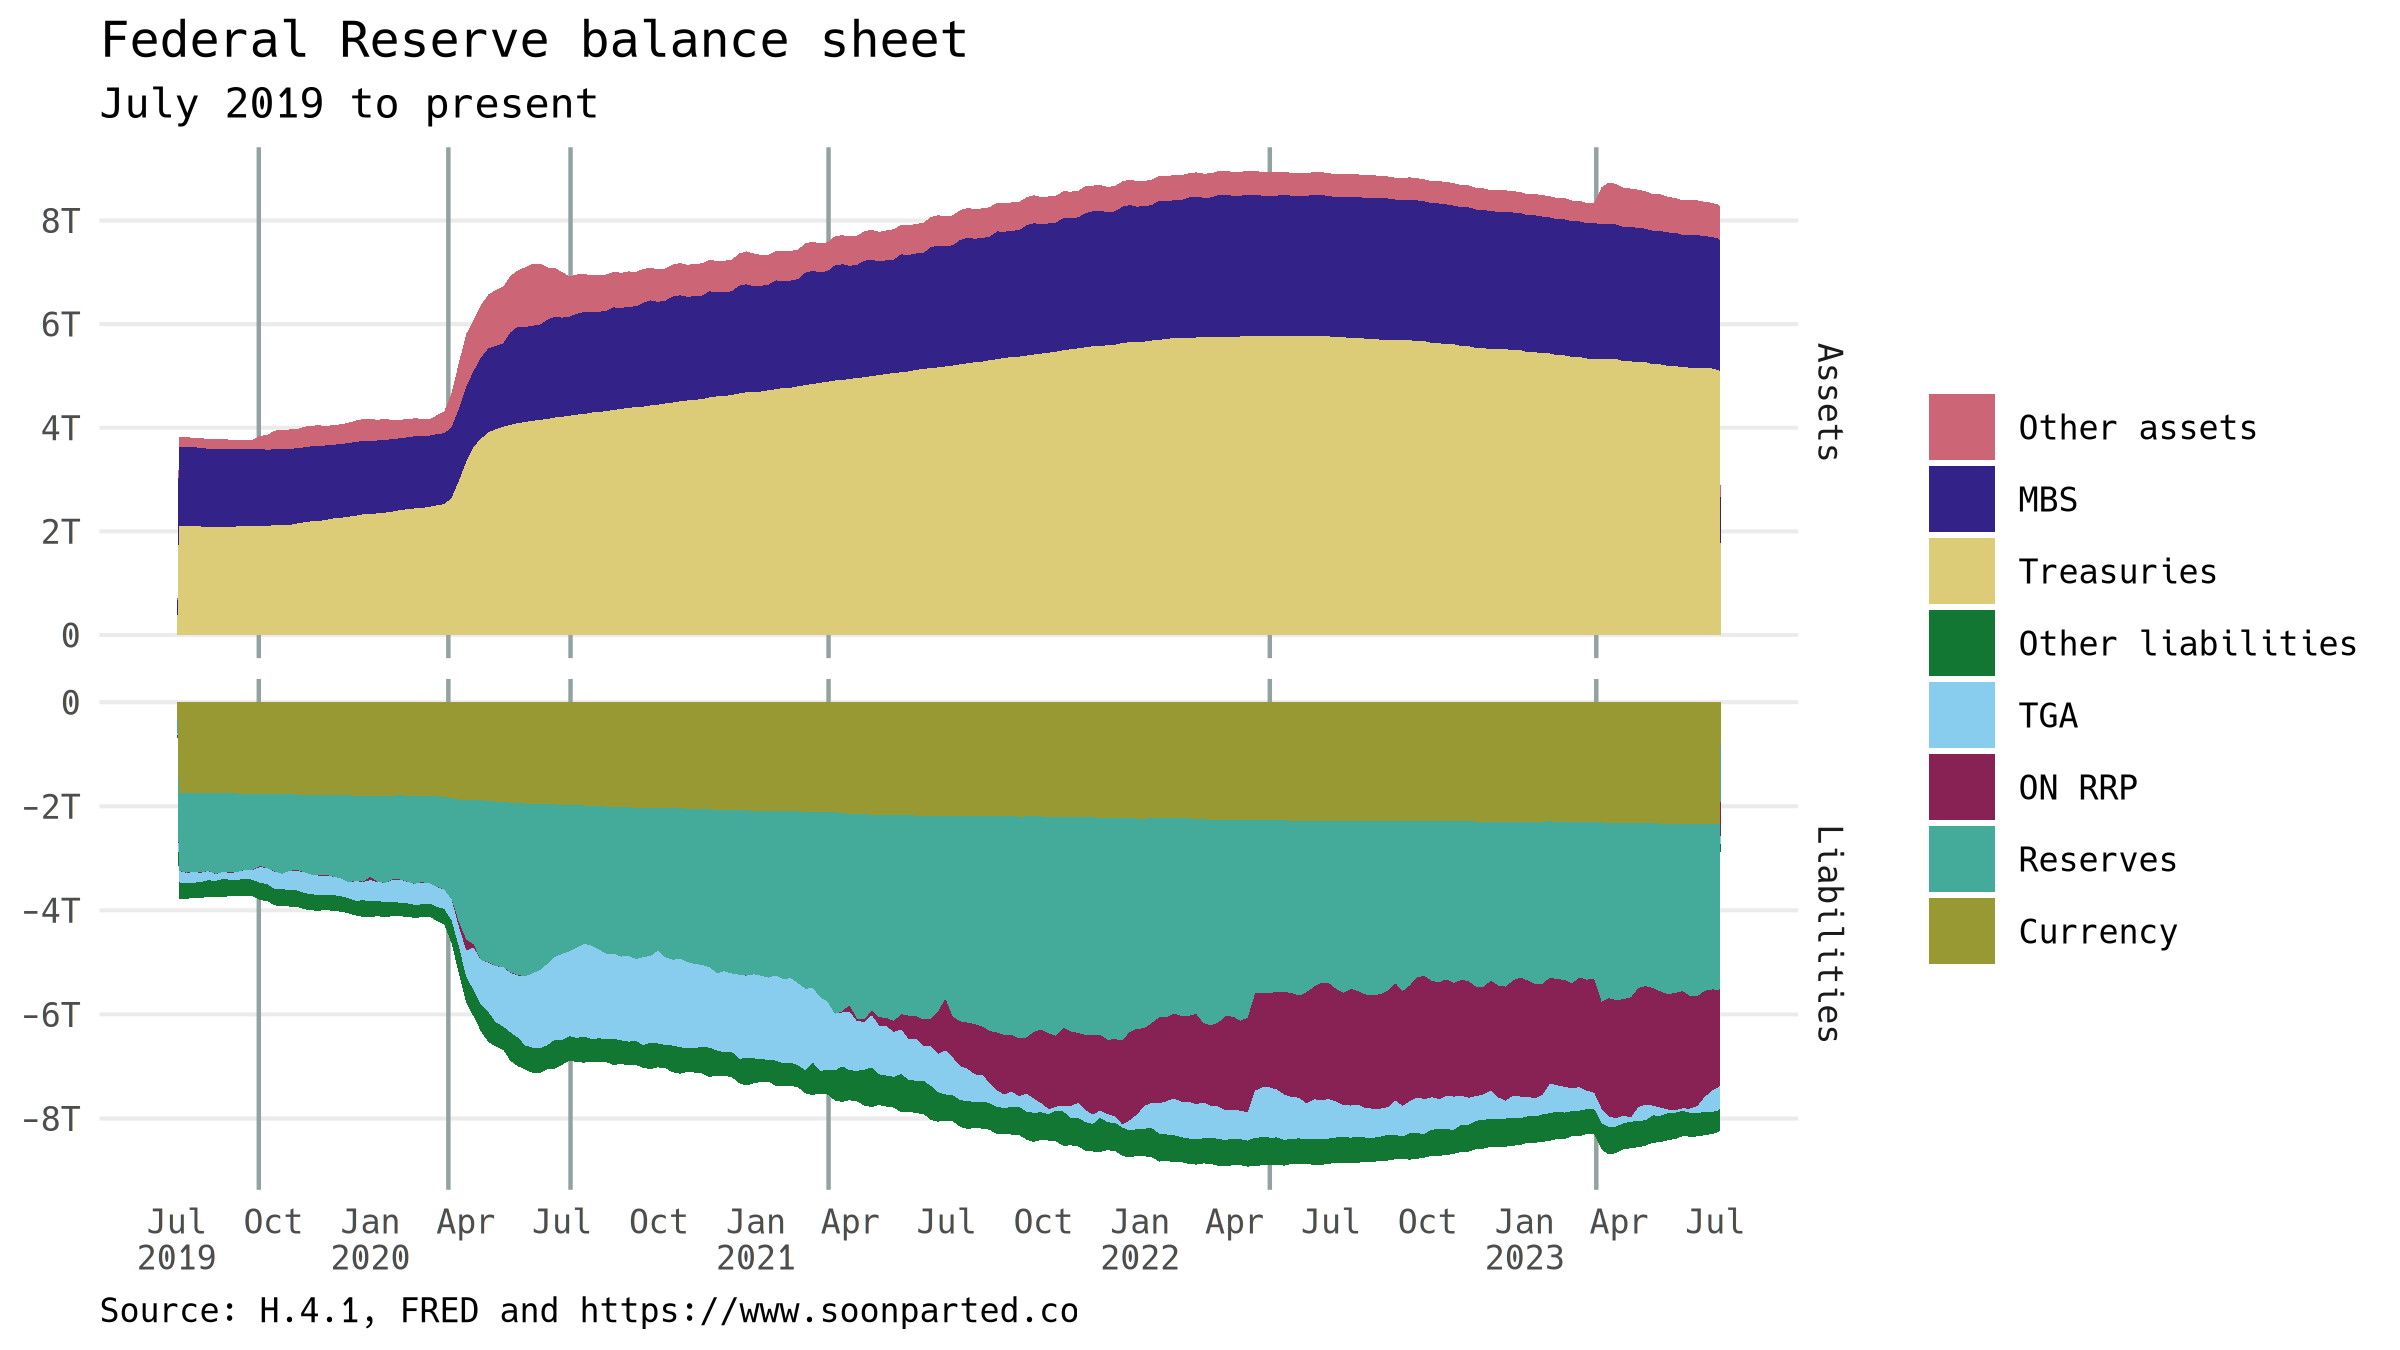
The two sides of the balance sheet always balance, so the reduction in asset holdings must be balanced by a contraction on the liability side. The graph below shows the same data above, but with each entry graphed separately, rather than stacked. Liabilities are shown in the right-hand panel. The most interesting entries are reserves, ON RRP, and the Treasury General Account, or in other words the deposits of banks, money market funds, and the US government respectively.
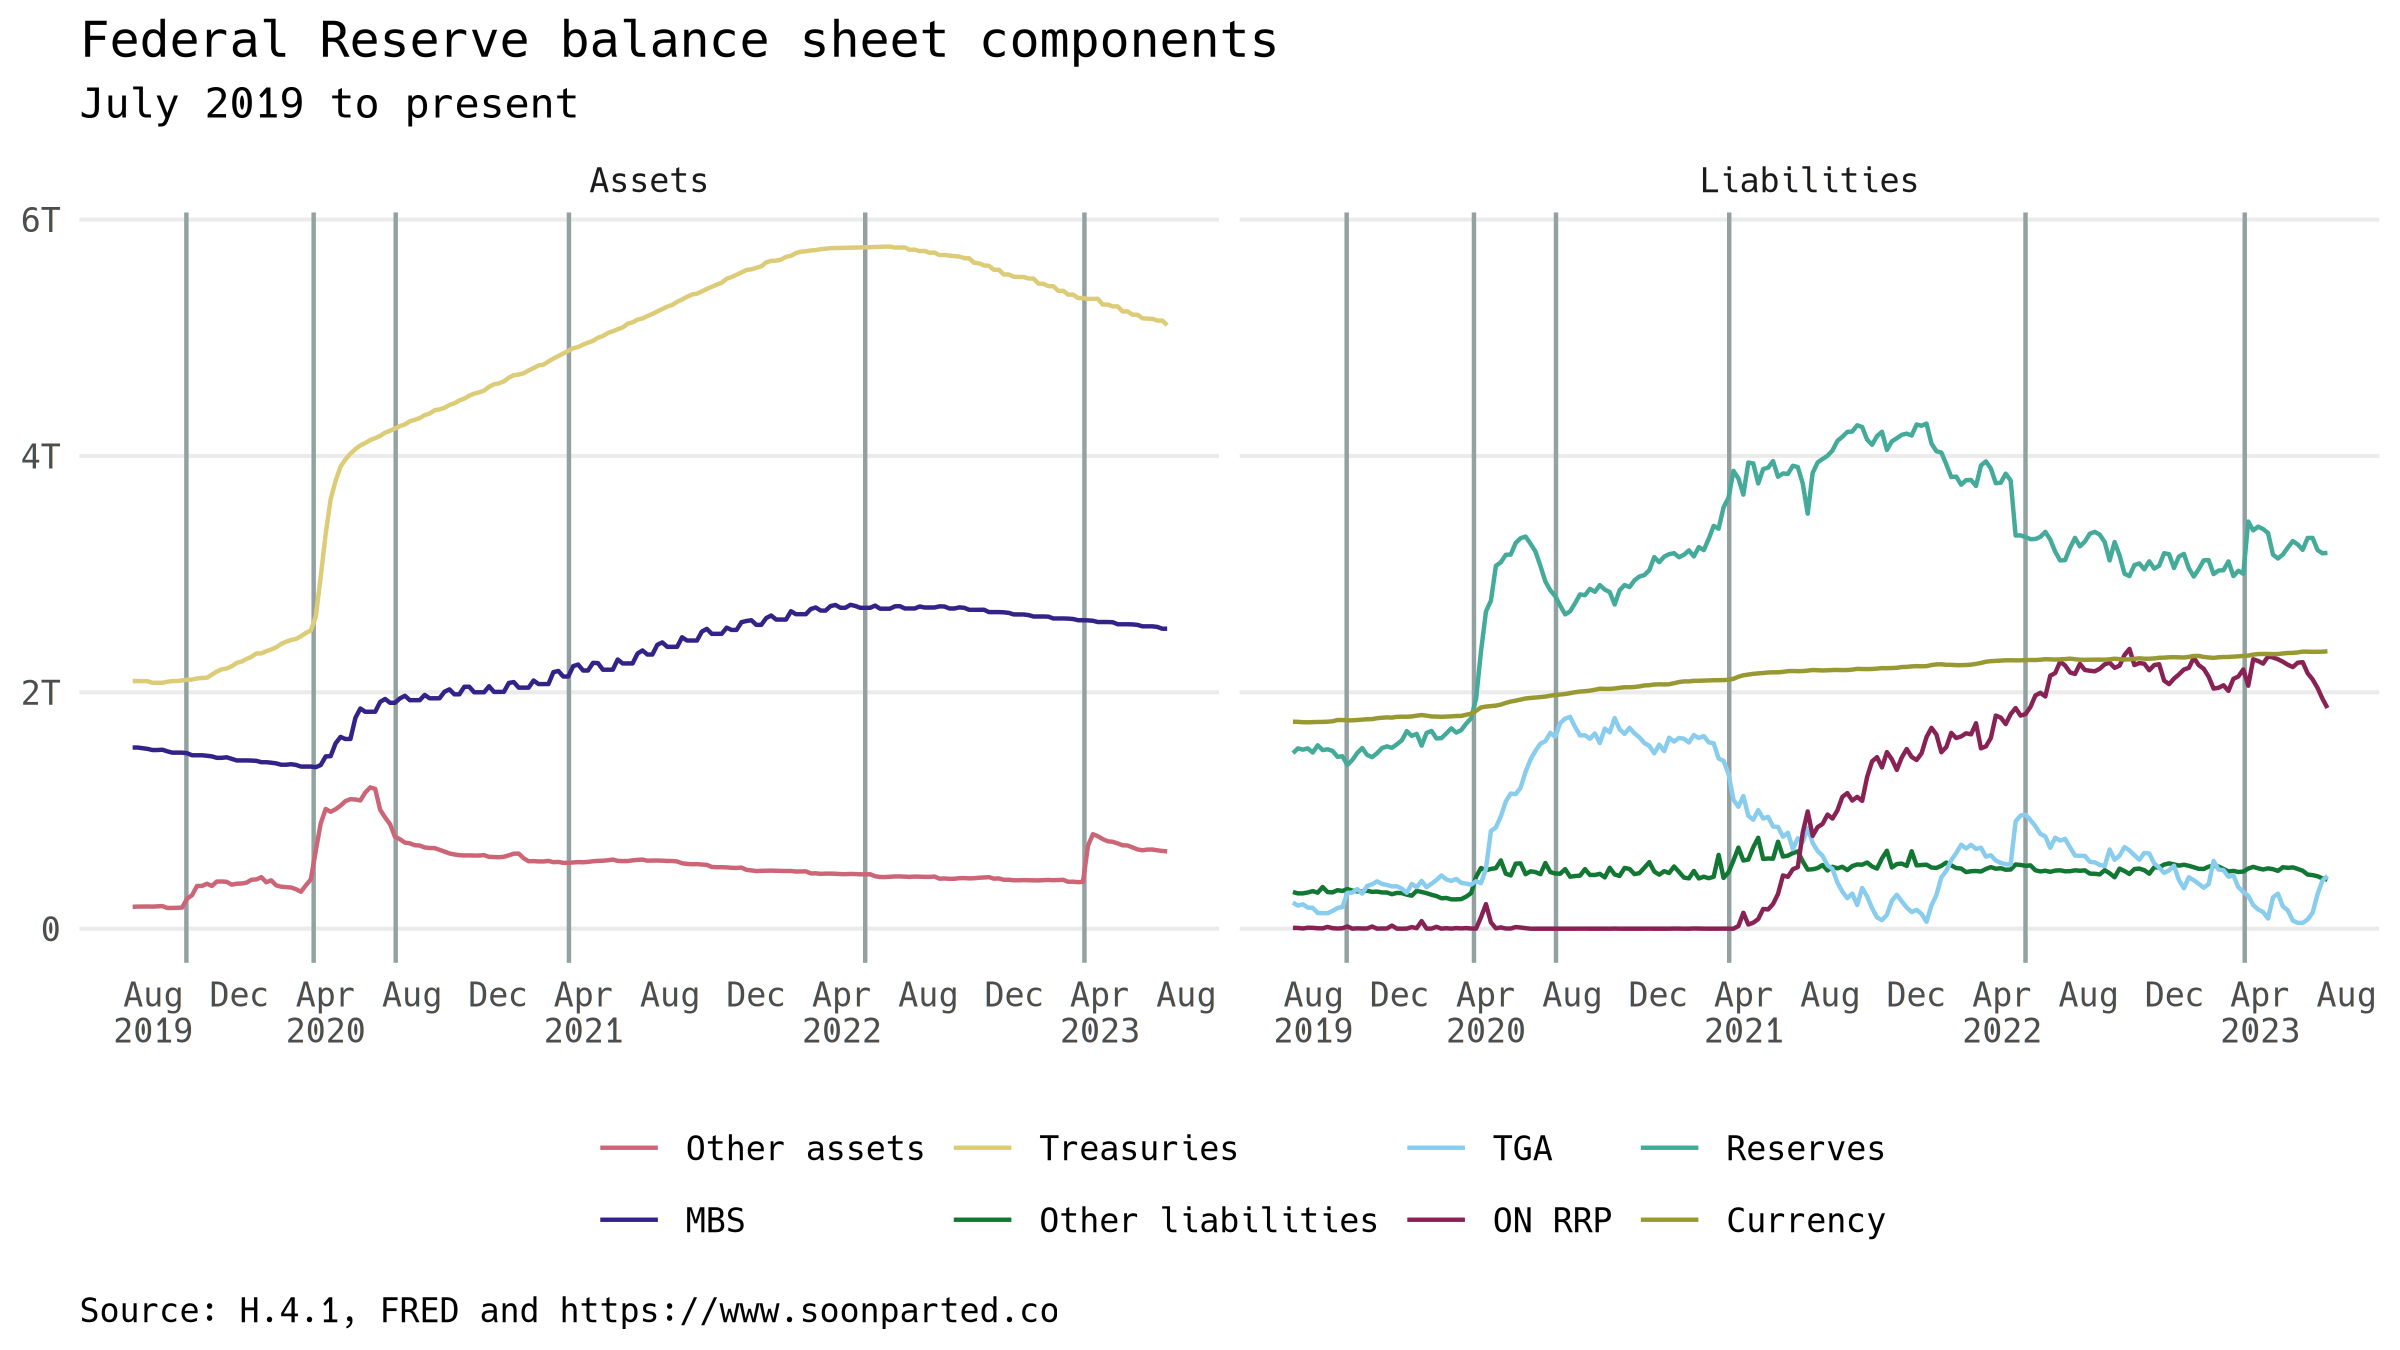
Squinting a little to smooth out the week-to-week variations, one can see that from April 2022 until June 2023, the contraction in assets was balanced by a decline in government deposits (the TGA). Constrained by the debt ceiling from borrowing more funds, the Treasury ran its TGA balance down almost to zero. This contraction absorbed essentially all of the Fed’s quantitative tightening.
Money market dynamics are now shifting
The dynamic changed in June, however, when the debt ceiling was suspended. The Treasury became able to borrow again, and has been busy doing so since then, replenishing its TGA balance. But the Fed’s total assets are still contracting, and so another liability has had to contract to offset the TGA. Finally the time has come for ON RRP usage to fall.
One big lesson to draw from this is that monetary change tends to happen in short, discrete bursts. It’s not so much “long and variable lags,” but more like “squeeze until it pops.” Contraction of the ON RRP facility is notable, because it is a reversal of central piece of pandemic monetary policy. (The shift is visible in money market rates, too—the subject for a future post.) It doesn’t immediately have further consequences—ON RRP contraction doesn’t automatically cause a financial crisis, or reduce inflationary pressure. But monetary conditions are changing significantly, with more to come.